Read more
Background
Cloudflare WAF (Web Application Firewall) is one of the oldest product offering and forms the core of layer 7 protection. Customers use WAF’s signature matching rules to protect their web application, with rules either managed by Cloudflare or create by the users themselves based on their unique need of protection. When a request passes through Cloudflare’s network, hundreds if not thousands of such rules match against this request, and if there is a hit, this request is terminated. To support users investigating what actions Cloudflare’s system has taken and why, in 2019, Firewall Events analytics was created, visualising the logs of every such hit.
But there is a catch. The system only logs entries when a request matches against any number of rules. What if a request did not match against any rule, such as a none threatening request which happen to the majority for most users? Over the years based on users feedback, this confusion came up pretty often in conversations. Further, how would the users be confident that the requests that passed through were truly legitimate? What if there are new attack types that the system did not know yet?
Research
New security framework
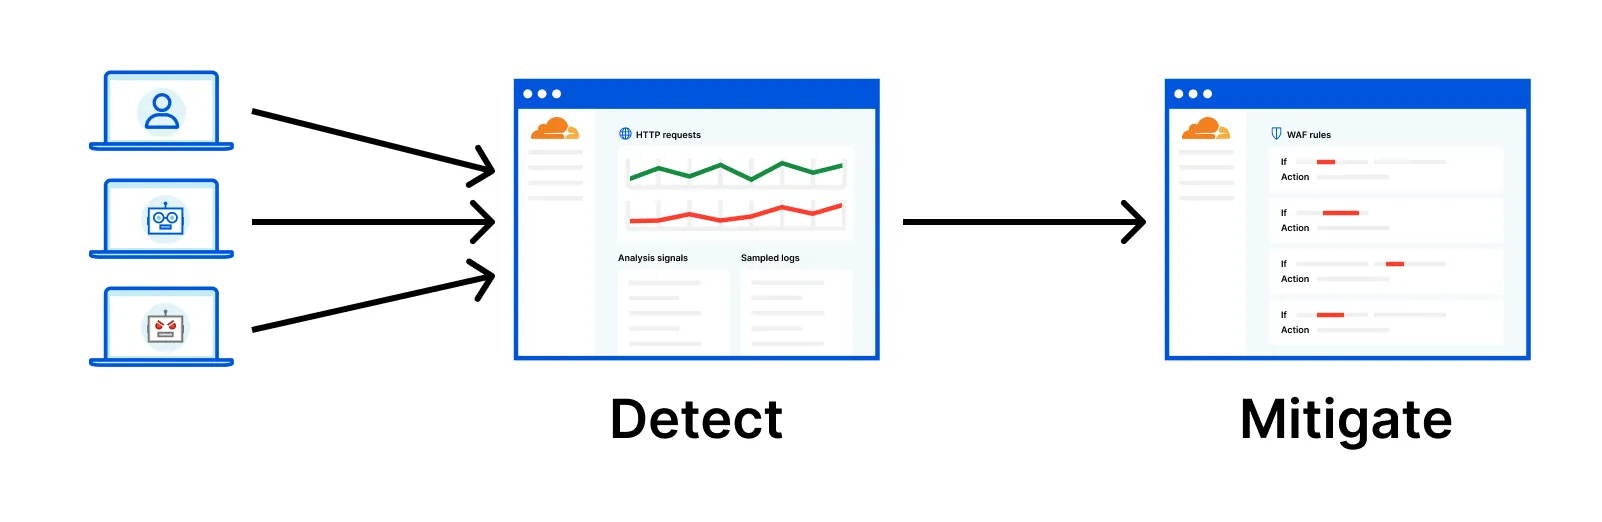
Before I joined the initiative to solve this challenge, a product manager had been exploring a new approach to enable the much valued visibility. Cloudflare does log the metadata of (sampled) all requests, and Ray ID can be used to link raw requests log and Firewall Events log, meaning users can potentially review how much portion of their traffic were mitigated. But to support users make informed decisions faster, we still need to enrich the raw requests log with signature matching insights which in itself is technically complex, but is well under way. This new security framework is summarised as detection then mitigation.
In total 6 user interviews were conducted to learn more about their current investigation procedures and discuss high level concepts of detection then mitigation. These interviews took place before I join the initiative, therefore only recordings and transcripts were analysed. The key takeaways concerning validating the new concepts are:
- Predictability is important as otherwise Cloudflare is simply a blackbox of magic. Workarounds exist though but not scalable.
- Confidence level of any firewall deployment is especially crucial for enterprise users, balancing between good protection and less false positives.
In order to achieve above goal, besides the new technological framework itself, by observing and listening to these interviewees, they commonly:
- Knows their applications well based on a combination of hostnames and paths and each require different type of protection.
- When they receive reports from their end users or when deploying new app release, they would like to open up the dashboard and confirm everything works still.
- Depending on their app and expected user type, different perspectives can be used to narrow down what matters such as IP ranges.
- Last but not least, they do appreciate the one-click-deploy experiences that Cloudflare offers with many features, keeping the complex simple is important.
Existing behaviours
Qualitative interviews form a promising foundation of the new security framework, but how do users use the existing Firewall Events analytics dashboard? What can we learn more, or validate the takeaways from the interviews?
One such analysis looks at the key interactions that users perform on the Firewall Events page. Within a day, which roughly equals to one intention of an investigation, the interactions users needed in order to achieve their goal. From above chart, data tell us:
- Use filters
- On average users add filter 4 times.
- While users remove filter 3 times, and only around 60% of users of whom have added a filter.
- Some users also edit filter which amounts to average 3 times.
- We can conclude that users do not only perform “zooming in” exploration, but “zooming out” as well. The hypothesises are: 1) a user observes an interesting pattern and wants to explore; 2) a user has a certain digging direction in mind, but either it is not highly specific or the filtered data surprised them.
- Change time range
- Currently it defaults to previous 24 hours.
- On average users change time range 5 times.
- Change logs page
- Currently per page lists 10 entries.
- On average users click to next page 8 times, which is surprisingly high.
- For clicking to previous page, average is at 1 time, and only roughly 30% of users who have clicked on going to next page.
- Expand/collapse log entry
- On average users click to expand a log entry 10 times, which may seem high, but not so much in the context of users flipping 8 next pages. We can roughly conclude that users would expand at least 1 entry on each page to examine details that may represent the rest of the entries on a particular page.
- What is actually surprisingly high is that, on average users click to collapse a log entry 10 times which is almost the same as expanding. This is probably due to a bug that we do not collapse an expanded entry when users flipping to a different page, which in principle the expanded entry should be collapsed. This means that our users learnt about this bug and adjust their behaviour accordingly.
Knowing that filters are important in an investigation based on both qualitative and quantitative analysis, the question still remains that where these filters are being applied as the current page offers many ways to narrow down the dataset. The chart above indicates that:
- Mostly filters are being added from Top N component, followed by Logs component.
- An interesting perspective is to look at the percentage of sources of removing filters with adding filters. This may indicate where exploration mostly happens meaning users try to add then remove a filter when they are a bit unsure. From the list below, we can conclude that filters that are being added from Logs contribute to a higher confidence, while Services is where users are uncertain about the filter choice.
- 32% - Logs
- 53% - Top N
- 55% - Time series
- 72% - Services
The same behavioural analysis was performed on other similar analytics pages as well and they reveal a highly similar pattern. This provides strong confidence in designing an interactive flow that focuses on narrowing down by users applications surrounded by various intentions, supported with a solid log stream.
Internal knowledge
We can argue that, concept validation interviews shine a light towards a direction; behavioural analysis indicate users motivations with assumptions. Still, are they inline with our regular conversation with (enterprise) users. To find out such, a workshop was arranged with various subject matter experts focusing on digging out 2 topics:
- What motivates users to examine security insights?
- What do they expect to perform to distill the insights?
Motivations
These scenarios are common starting points of using analytics dashboard:
- Based on user report (of errors).
- Based on origin report (of errors).
- Need to monitor specific vulnerable area, such as payment pages.
- When a new endpoint or app has been deployed, thus widen the attack surface.
Besides these scenarios, one topic that has been mentioned a lot is around traffic pattern changes. This is a wide category that can include such as, error rate, CPU usage on origin, etc. One way to look at this topic is that, it provides a strong perspective when users are reviewing the dataset. It can be complement to what users are looking at. The additional dimension this topic brings onto the table is about time scale, as depending on how aggressive the pattern changes, the required time scale differs. This leads to an exploration opportunity that, how does time scale match what a user wants to achieve.
Expectations
And certain combinations or abstractions of filters help users reach confident decisions:
- Based on backend application, such as by path or hostname.
- Based on certain vulnerability, such as CVEs.
- Based on analysing of payload data, such as data type, data size.
- Distinguish between automated traffic v.s. traffic from real persons.
- Distinguish between “good” v.s. “bad” traffic.
These are just examples of possible abstractions. Interestingly, except the last one, the rest abstractions are based on objective data. There are various elements that contribute to a final decision whether a request can be classified as “good” or “bad”. The approach to such decision can be useful in the context of discovery, which also contributes to further investigations.
Datasets and data fields
All above researches confirm a use case driven investigation patterns instead of a system (mitigation) action driven approach. Are existing datasets and data fields support visualising such patterns?
By reviewing existing datasets, it is clear that an attempt was made in the past, but not successful. For instance, many field names start with the phrase client, e.g. clientASN, while some others that are also commonly associated with end users like userAgent does not hold such starting phrase. When building an interface that uses these fields behind the scene, one can ignore how they are named. Though such APIs are also used by users as well as other internal teams. A clear semantics adds value to how they can best be used. Hence an exercise was made to propose a possible approach of categorising data fields based on user needs, contributing to future naming of such fields across multiple data systems. The high level categories on a use case driven approcah can be:
- Where the requests are originated
- Where the requests aim to hit
- Time range and sample rate
- Security/System measurements
Concept
The researches from various perspective can be concluded with the following key takeaways in terms of user expectations of better protecting their web applications with confidence:
- Users usually visit (analytics) dashboard with a purpose in mind, such as from an external report, or a new application deployment.
- Trend deviation analysis requires exploring multiple different time ranges.
- While more “managed” solutions are being worked on, users still need to examine and spot irregularity with a combination of perspectives.
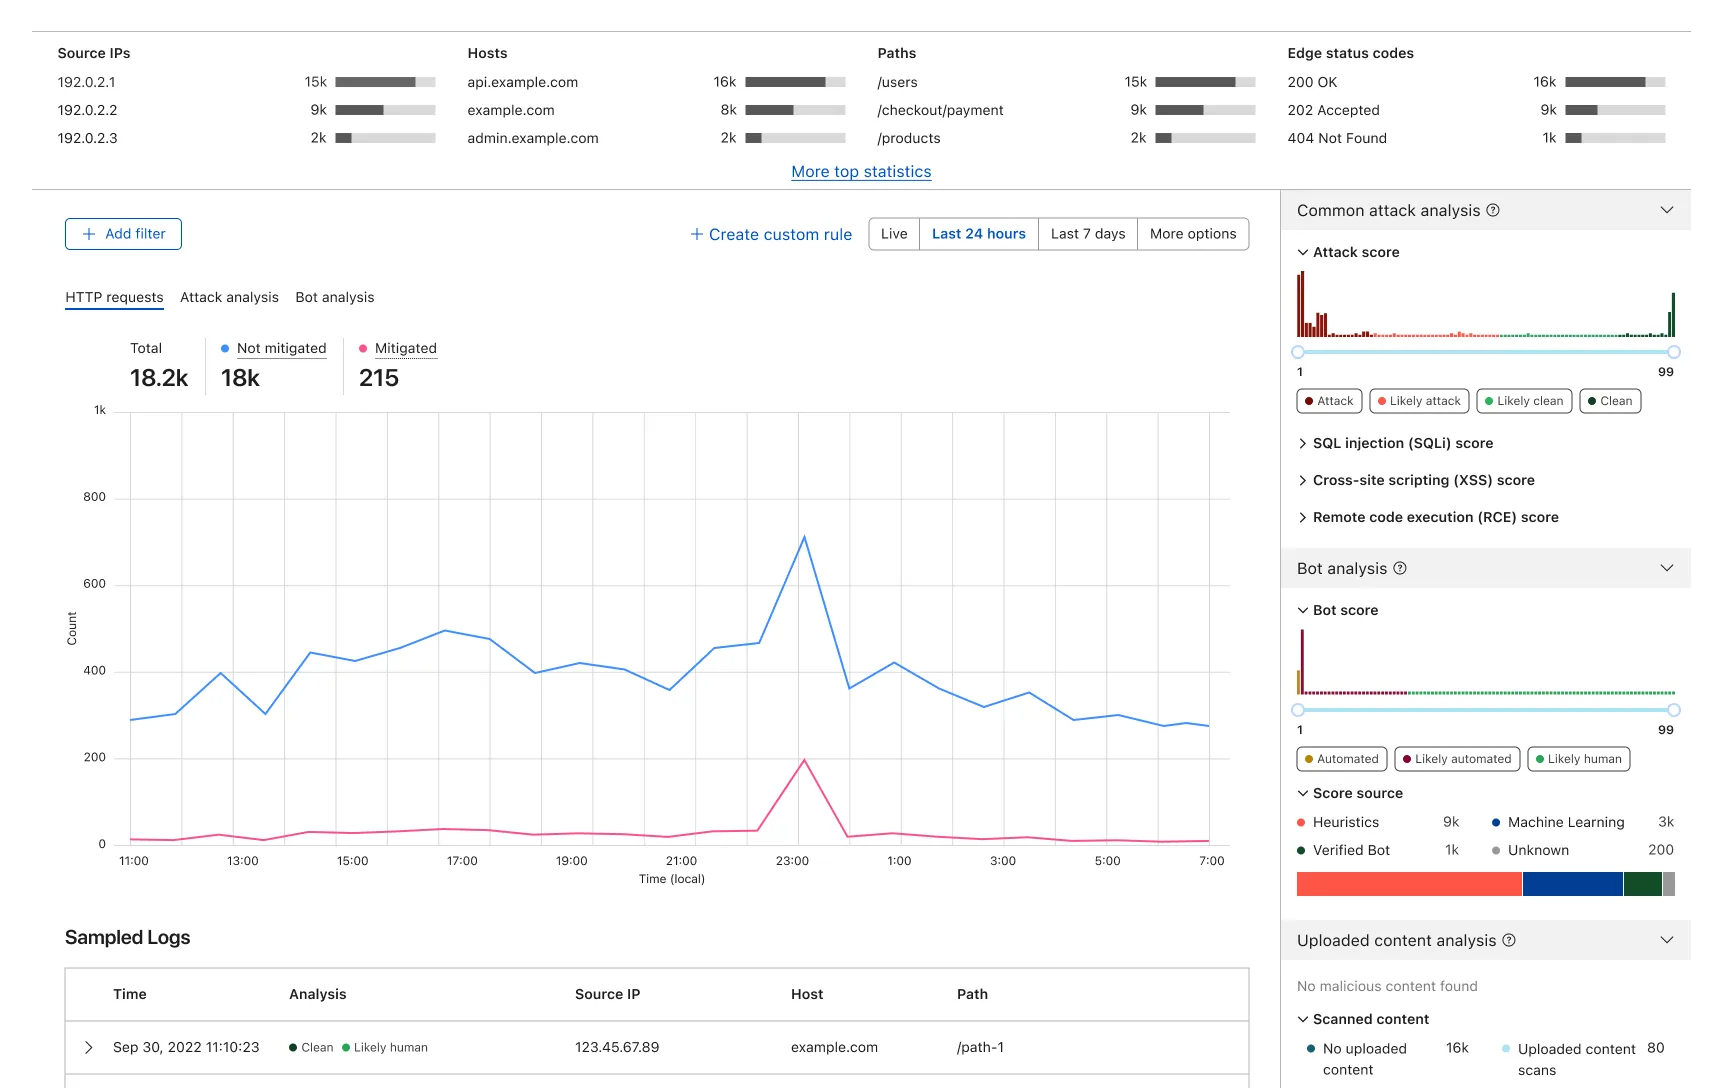
- Users appreciate narrowing down the view supported by data visualisations, such as using Top N lists, score distribution chart, etc.
- The advantage of using Cloudflare is that Cloudflare enables features works together, however users complaint that it is challenge to drill down an incident which requires using multiple analytics views.
These insights lead to sketching a new analytics experience of below key changes compared with the existing view.
- Elevated goal driven filters to encourage initial focusing.
- Center stage the time based trend deviation spotting, surrounded by various way to narrow down the data.
- In data representations, group fields into meaningful categories easing information overload.
- Last but not least, make sure log stream is easily accessible to confirm the hypothesis users made.
One key challenge of designing such analytics pages is that, even there were solid research foundations to make informed design decisions, being able to plot real data and use it to collect feedback under genuine investigation cases provide much more value than sketching and prototyping in any interfacing tool like Figma. Not only that sketching real-like data plotting in such tool is time consuming, but also that such prototype require feedback participants to not only learn about a new interaction flow but also trying to make sense of some fake data. Therefore, the majority of my effort was spent with the frontend team looking into what data can be queried and how we can plot them based on above directions.
Internal feedback of prototypes
With the real prototype built together with the frontend team, we invited several solution engineers to try out the prototype on some production applications to interate before public release. Specific tasks were given during the interview besides general feedback to validate if the participants understand what they are looking at.
As the foundamental dataset used in this analytics page differs from the existing Firewall Events analytics page, and there are new intelligence concepts introduced thanks to using a dataset such as WAF Attack Score, one common feedback from the sessions is that, there is a noticable learning curve before users can make the best out of new capabilities. Is there a way that we can flatten this learning curve and deliver value faster?
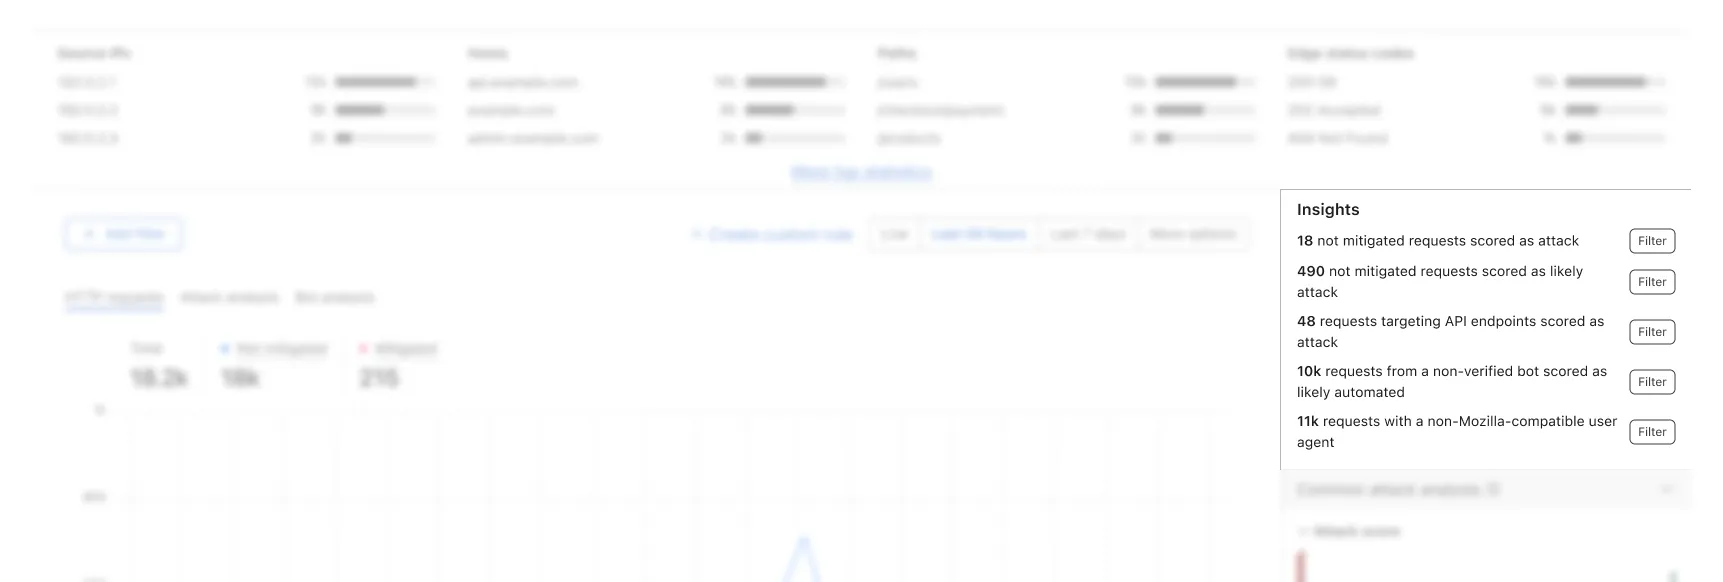
As mentioned above, besides like application focus as a starting point, a combination of different perspectives allows users to pick out anomalies that requires attention. With the introduction of the new intelligence and internal knowledge of common attack vectors, a new widget was created within a day that wasn’t part of the original proposal, but solely based on the internal testings. This new widget is named “Insights”, sitting higher up above the fold, highlighting requests counts of hand crafted combinations of filters. With this addition, we invited few more internal testers to validate this assumption and the outcome was positive.
Next steps
The tight collaboration between product, engineering and design has proven to be highly efficient comapred with the existing planning processes. The core team including myself keeps pushing forward with such fast iterative approach, making constant improvements to this experience based on concrete user needs. For further updates of major upgrades to the security analytics experiences, follow Cloudflare blog.